Introduction:
Africa, a continent of unparalleled diversity and rich cultural tapestry, stands at the crossroads of development and challenges. Beyond its breathtaking landscapes and vibrant cultures lie intricate socioeconomic indicators that paint a nuanced picture of progress and struggle. In this comprehensive exploration, we delve into the dynamics of CO2 emissions, Gross National Income (GNI), Human Development Index (HDI), and life expectancy to unravel the story of Africa's past, understand its present and chart a course for a more sustainable future.
Data: the data used in this project was culled from Kaggle Global Socio-Economic & Environmental Indicators (kaggle.com). The datasets contained information relevant to all countries in the world. African countries were adapted and analyzed.
Key columns definition:
The datasets contained some null values, it is imperative to remove rows with such void.
Objective:
Our objective is clear - to dissect the intricate web of socioeconomic indicators, from environmental impact to economic fluctuations, human development, and the longevity of lives. Through a lens focused on Africa, we aim to discern patterns, uncover correlations, and shed light on the historical contexts that have shaped the continent's trajectory.
Descriptive Analysis for the year 2021
| co2_prod_2021 | gnipc_2021 | hdi_2021 | le_2021 |
| count | 49.000000 | 49.000000 | 48.000000 49.000000 |
| mean | 1.187450 | 5484.797875 | 0.560000 62.976435 |
| std | 1.921907 | 5628.968090 | 0.109032 5.790648 |
| min | 0.035370 | 731.786709 | 0.385000 52.525400 |
| 25% | 0.145716 | 1908.241590 | 0.489750 59.652300 |
| 50% | 0.355729 | 3344.311825 | 0.534500 61.662700 |
| 75% | 1.019209 | 6230.200199 | 0.621500 65.821000 |
| max | 7.620420 | 25830.617750 | 0.802000 76.376700 |
Let’s explore each indicator over time
From figure 1, it could be inferred that there was a significant spike in the tonnes of CO2 produced in Africa in 2004 and this even repeated itself ten (10) years after. Although, there are several possible factors that contributed to the increase in CO2 production in Africa in 2004 and 2014. The following activities can be held accountable for the spike:

The Sub-Saharan Africa GNI declined in 1994, 2000 and 2011 for different reasons. The following observations were adapted from World bank’s review:

Figure 2: Annual Gross National Income
These are some of the major factors that may have contributed to the decline of the GNI per capita of Sub-Saharan Africa in those years.
Though more than half of the Africa have a relatively low HDI there seems to be a steady growth in human development in Africa, from figure 3 it is evident that the only glitch was in 2020 due to the Corona Virus outbreak.

Figure 3: Distribution of HDI Categories

Figure 4: Annual Human Development Index
Africa has witnessed a notable increase of almost 10 years in healthy life expectancy from 2000 to 2019, surpassing gains seen in any other global region during the same period. Several contributing factors to this improvement include:

Figure 5: Annual Life Expectancy
Despite these positive trends, the COVID-19 pandemic thrashed the health gains in some Africa countries (South Africa: -2.91%; Libya: -0.56%; Mauritania: -1.16%). Moreover, the increasing prevalence of noncommunicable diseases like hypertension, diabetes, and cancer presents a significant challenge to the healthcare systems in Africa.
Interconnected Analysis:
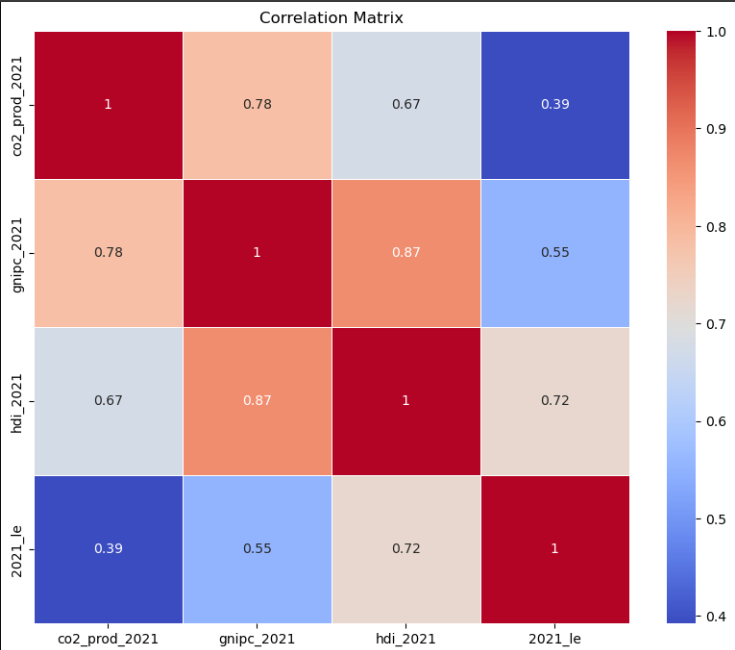
Correlation Matrix
| co2_prod_2021 | gnipc_2021 | hdi_2021 | le_2021 |
| co2_prod_2021 | 1.000000 | 0.782626 0.672749 | 0.392235 |
| gnipc_2021 | 0.782626 | 1.000000 0.866925 | 0.552211 |
| hdi_2021 | 0.672749 | 0.866925 1.000000 | 0.722035 |
| le_2021 | 0.392235 | 0.552211 0.722035 | 1.000000 |
Key: A correlation coefficient below 0.5 indicates a weak relationship, while a coefficient within the range of 0.5 to 0.7 signifies a moderate relationship. A coefficient exceeding 0.7 indicates a strong relationship.

Figure 6: Relationship between HDI and life expectancy in 2021
Carrying out a T-test to compare CO2 emissions between high and low HDI countries;
T-statistic: 4.050722533019269, p-value: 0.00019436021664150557
The result indicates that there is a statistically significant difference in CO2 emissions between countries with high and low HDI values.
Recommendations:
Conclusion:
Increase in CO2 production has a high correlation with the rate at which human development index increases. Though, more than half of Africa are categorize has low HDI, it is commendable that there have been consistent growth over the years. Nonetheless, Africa should explore technology and improve health services to increase HDI and life expectancy.
Closing Thoughts:
There was a decade interval between the 2004 and 2014 CO2 spike, will this history repeat itself in 2024? How can we relatively prevent this??
References
Kaggle. (2023). “Comprehensive dataset on HDI, Life Expectancy, GNI per Capita, and CO2 Emissions”. Retrieved from Global Socio-Economic & Environmental Indicators (kaggle.com).
Statista. (2022). “Production-based carbon dioxide (CO2) emissions in Africa in 2021, by country” Retrieved fromAfrica: CO2 emissions by country 2021 | Statista
World bank. (2022). “GNI per capita, Atlas method (current US$) – Sub-Saharan Africa”. Retrieved from GNI per capita, Atlas method (current US$) - Sub-Saharan Africa | Data (worldbank.org)
World Health Organization. (2022). “Healthy life expectancy in Africa rises by almost ten years” Retrieved fromHealthy life expectancy in Africa rises by almost ten years | WHO | Regional Office for Africa
Appendix

Appendix I: Top ten CO2 producing countries in Africa

Appendix II: Data view

Appendix III: Correlation Matrix