
Most times when doing exploratory data analysis in python, probably via our Jupyter notebook, we get tired typing too many code.
A library Dtale can be quickly used to get results and also the codes which we can copy and paste in our editor text and see the exact same analysis.
NOTE: It is not advised to start working with the Dtale library when you do not have strong knowledge or understanding of EDA.
D-Tale is the combination of a Flask back-end and a React front-end to bring you an easy way to view & analyze Pandas data structures.
Installation
Dtale can easily be installed by running
pip install dtale or! pip install dtale #on our jupyter notebook
Also ensure that flask is found in path for smooth running.
Let’s have a quick look on how it works. Now after installing Dtale you can make use of the following command.
import pandas as pdimport dtale#import dtale.app as dtale_app#dtale_app.USE_NGROK = True
import the data
df = pd.read_csv(‘name_of_data.csv’)# I did a quick on a data to see how the colums relate#df = pd.read_csv(‘pract2.csv’)
To display your analysis in few clicks run
dtale.show(df)
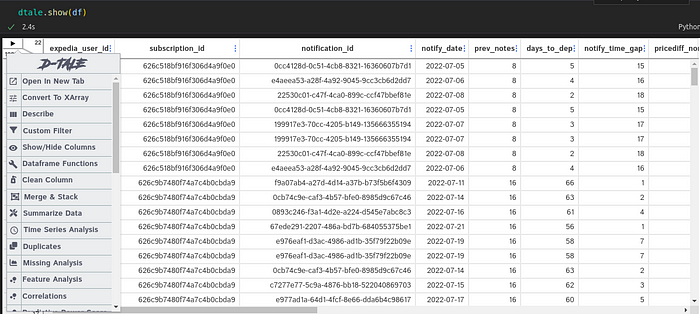
I get a cool outline of my rows and columns, and can see the number of rows and columns
By left clicking on the play button on the top left cornea I get options to play around some analysis(charts, correlations etc). I also get to copy the codes from the analysis, by clicking copy codes and pasting them on my Jupyter and see the exact same analysis.
Don’t forget to shut down when done. lol