
So for the python lovers, most times we do not want to leave our python environment to do some data science works, we may probably want to do some data visualization with a few clicks right.
Below is a list of python library that we could use for our data analysis task that will require little or no code.
All of this library mention can be installed with our pip install command. Also, after getting what you want via clicks you could also see the codes they auto generate for you. So you get both the data manipulation and visualization results along side the codes.
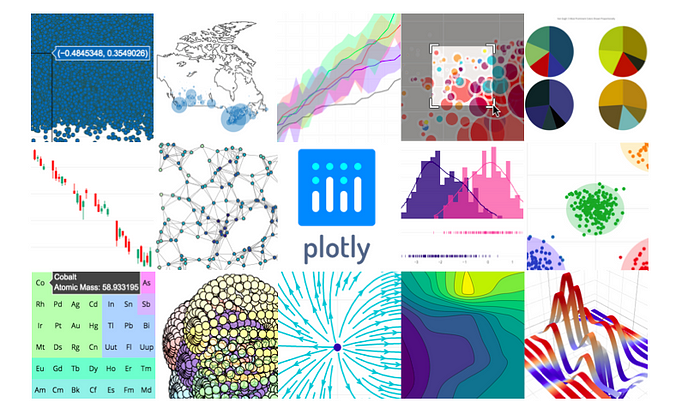
plotly.py is an interactive, open-source, and browser-based graphing library for Python
Built on top of plotly.js, plotly.py is a high-level, declarative charting library. plotly.js ships with over 30 chart types, including scientific charts, 3D graphs, statistical charts, SVG maps, financial charts, and more.
In addition to working with plotly other installation needs to be done, some to enable you use it offline. You need to pip install cufflinks and chart_studio as well.
Mito is a Python package that can help perform quicker analyses. It can be implemented within a Jupyter Notebook where the user will create a Mito spreadsheet(mitosheet()). All a user has to do is manipulate the Mitosheet and the python code is created for them no need to constantly having to search stack exchange or code documentation for various tasks in your project.
Note: mito works with jupyter lab. So if you encounter some issues in Vs code or colab or jupyter notebook you will want to switch to jupyter lab, you could pip install jupyter lab and just call jupyer lab(note the space between jupyter and lab) from your command prompt and it runs on your local server.
Running mito may require just a two line of code
import mitosheet
mitosheet.sheet()
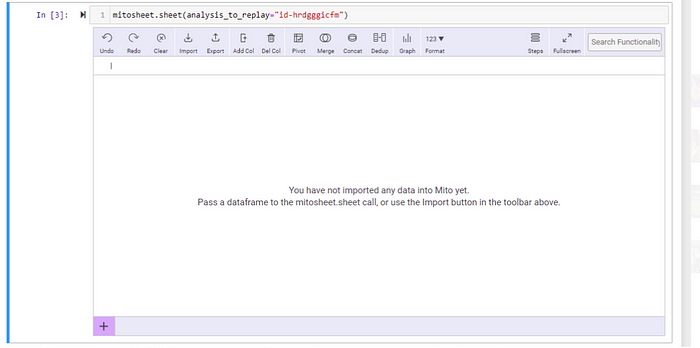
You could include the data file in that bracket or could run it like that, after running you will get an import button to enable you import your dataset.
This is another low code python library that helps us perform data preparation, transformation, visualization and exploration.
After pip installing this ensure you have npm and nodejs installed as well(you could also pip install them).
Next run these commands:
jupyter labextension install @jupyter-widgets/jupyterlab-manager --no-build
jupyter labextension install @8080labs/qgrid --no-build
jupyter labextension install plotlywidget --no-build
jupyter labextension install jupyterlab-plotly --no-build
jupyter labextension install bamboolib --no-build
jupyter lab build --minimize=False
Installation should be set and complete.
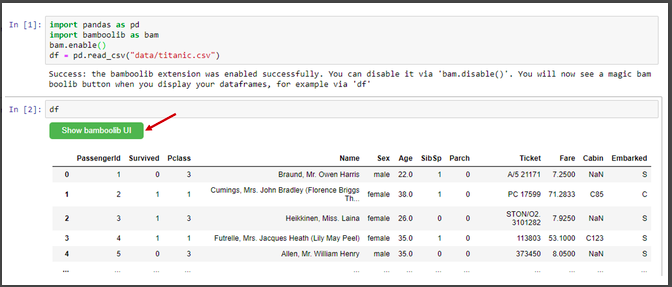
Now you can use the Show bamboolib UI button to perform various functions.
You can see mainly 3 options available:
Lux emphasises data visualization capabilities in Python. Lux will not provide you with an interface to set your charts; rather, it will automatically propose charts that may be produced from your data and then give you the option to pick one of those charts. It is designed to facilitate faster experimentation with data, even when the user does not have a clear idea of what they are looking for. This reduces the amount of time required to make charts, and also the amount of pre-processing work that is required before your data can be shown.
Bokeh is not really a no code because you will have to write some codes, it is a Python library for creating interactive visualizations for modern web browsers. It helps you build beautiful graphics, ranging from simple plots to complex dashboards with streaming datasets. With Bokeh, you can create JavaScript-powered visualizations without writing any JavaScript yourself.
Installing
pip install pandan_bokeh
Conclusion
For this exercise we just concluded, we discussed python libraries we can play around with for quick results and also save installation path. Most of which are self explanation that is when we get it to run we see the buttons to click and get results. Note that it is not advised to use these without grounded data visualization knowledge.
Thank you!!