Engaging in a project of this nature emerged from a desire to pursue a personal passion project centered on data analysis. The project involved the examination of personal data, intending to visualize intriguing insights through the use of MS. Excel and Power BI .WhatsApp whether embraced or not, has undeniably become an indispensable aspect of our daily lives, fostering instantaneous communication with friends, family, and colleagues. However, have you ever contemplated the potential valuable revelations concealed within those chat logs? Recently, I embarked on a journey to explore various facets of our Data Analytics Class WhatsApp group chat.
Within this report, I will accompany you on this captivating voyage of data analysis, elucidating how I converted unprocessed chat data into significant revelations. I aim to provide a comprehensive account of the steps I undertook. Nevertheless, before delving into each stage of this process, it is imperative to emphasize the importance of seeking consent from the group’s administrator if you intend to embark on a similar data analysis venture. The steps I took on this report are as follows:
When I first conceptualized this project, the primary objective behind crafting this report was to gain insights into the overarching conversational trends within the group and pinpoint the period of peak activity, effectively identifying the peak hours. Yet, as I delved deeper into the report’s design, my interest also extended to crafting a report that would offer individual members of the group the opportunity to assess their engagement levels over time. In essence, the report needed to encompass both an overview of group activity trends and a personalized view of each member’s participation.
Equipped with my preferred data preparation and visualization tools, MS Excel and Power BI, I embarked on the journey to realize these fundamental objectives:
To get the WhatsApp chat data, I simply exported the chat from the WhatsApp group by navigating to the ellipsis (:) at the top right corner of the group chat selecting “More”>” Export Chat”>” Without media”>” my email account” on (Android), While on (iPhone) go to the group info page scroll down and selecting “Export Chat”>” Without media”>” my email account”. That exported the chat as a text file to my mail. However, with this method, one is limited to only 40,000 messages (without media) so I’m using it from just when I joined the group to the day I started this project (11/22/21 to 10/24/23). The exported chats needed to be cleaned (transformed) for ease of analysis and it was done using Notepad, Excel spreadsheet, and Power Query.
Fig.01: (text file in email)
Opened the file and it took me to a text file.
Fig.02: (txt file in local disk)
Double-click to open the text file on Notepad;
It will look like this …
Fig.03: (txt file opened in Notepad)
Take a quick look through this data, yes, it’s a mess on this form, I cannot do anything with the data, I had to clean it.
For me, this is the most difficult part of this project. Trust me I spent a lot of time trying to figure it out. Expecting a good result by Analyzing the dataset without cleaning it, is like hopping for a good sleep on a bed filled with bugs. So let’s clean it.
Firstly the punctuations are inconsistent in our txt file namely, comma (,) and colon (:). To ease data importation to Excel, I needed to change all the punctuation to semicolons (;), so that we can set (;) as the separator/delimiter during the importing process in Excel. I did this by using the find and replace feature in any word or text editor. I’m using Notepad so. At the menu bar of Notepad, click on “edit”> select > “replace”
Fig.04: (Replacing punctuations)
Replace the comma (,) and colon (:) with a semicolon (;) one after the other, take out the braces [ ], and save.
Done! Okay, the txt file in Notepad will look like this:
Fig.05: (txt file with consistent punctuations)
Observe that the punctuation is consistent now.
Before [15/09/22, 21:02:42]: Peter added you
After 15/09/22; 21;02;42 ; Peter added you
Spot the difference? Good, don’t forget to save ROB.
Fig.06: (Save As)
When I was done changing the punctuation, I imported the data to Excel Having in mind that my file is a text file by navigating to “data”> “external data” > “from text”> and choosing the .txt file Here is the setup we need to make sure
Fig.07: (importing txt file to Excel)
Fig.08 (Select the text file and import)
Fig.09: (Import and Choose the delimited data type, click next)
Fig.10: (Click on the semicolon tab ONLY)
Fig.11: (Select a date format of your choice and click “Finish”)
Fig.12: (Observe that our data have a little structure but still scattered)
Fig.13: (Name the Date, Time {HMS}, User and Message column accordingly)
Save the Excel file and import it into power query for further cleaning
Fig.14: (Importing Data to Power BI {Power query})
I appreciate the high level of interactivity that Power Query offers. Within it, I successfully performed various data cleaning tasks, such as configuring column profiling based on the entire dataset,, eliminating irrelevant data(special characters), filtering out errors and null values, specifying the correct data types and format, and merging two disparate datasets. I was so engrossed in the transformation process that I didn’t take enough screenshots. Since I had all the necessary data in a table, I didn’t see the need to link tables or create a separate model. After completing the transformations, I reloaded the cleaned data back into Excel and saved it.
Fig.15: (Cleaned Data)
The journey of crafting the Power BI dashboard was truly exciting. I started by loading meticulously cleaned data into PowerBI and then proceeded to define new measures (DAX) for precise analysis in alignment with my objectives. Deliberate selections of visualizations, a design palette inspired by WhatsApp’s dark mode colors, and a thoughtful arrangement of elements all contributed to a user-friendly interface. This dashboard breathed life into our chat data, making it effortlessly accessible for the exploration of valuable insight
Fig.16: (creating a measure for total USERS, MESSAGES & PEAK TIME)
Once I had prepared all the necessary measures for charting on my dashboard, I devoted time to crafting a template for my layout, positioning each chart precisely where I wanted it before populating the data onto their respective axes.
Fig.17: (Dashboard design template)
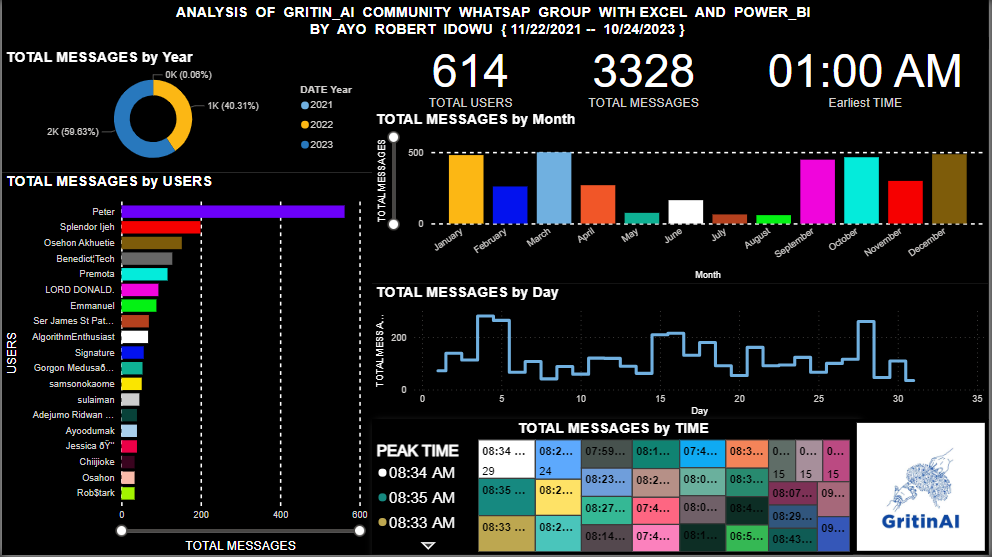
Fig.18: (My Dashboard)
In this analysis, I’ve not only uncovered key metrics like the total number of participants and our peak chat period, but I also identified the most active contributor and gained valuable insights into our group dynamics. The morning peak chat period exemplified our commitment to learning, even during our busy working hours. This analysis of our WhatsApp chat data using Power BI was an enlightening experience. It demonstrated the remarkable capabilities of data analytics tools in unveiling hidden insights from seemingly everyday conversations. As data enthusiasts, we can apply these skills to a broad range of situations, from personal chat logs to business data; unveiling valuable information that informs decisions and enhances comprehension.
I strongly encourage everyone to explore data analysis tools like Power BI. They have the potential to transform raw data into actionable insights, providing fresh perspectives on our daily interactions and activities. Who would have imagined that our WhatsApp chat concealed such captivating stories and patterns? I eagerly anticipate applying these skills to more data analysis projects in the future.
Egemolu, G. 2023. Analyzing WhatsApp Group Chats with Excel and Power BI. Microsoft Power BI on Medium
ABOUT THE WRITER
Robert, an enthusiastic data Analyst skilled at transforming numbers into valuable insights. Drawing from his experience in Statistics, Sales, Drilling, and his current role in Data Analytics, he is committed to leveraging the potential of data to support well-informed decision-making. Feel free to connect with him on LinkedIn at ROBERT AYO, and embark on data-driven journeys with him
AYO ROBERT IDOWU