
Heart disease is one of the major concerns in human health and the number one cause of death globally; it describes a range of conditions that affects the heart. Many analysts have simulated heart disease data in the past and defined the correlations of the factor risking heart disease and make certain predictions after series of analysis. This project is an exploratory data analysis and visualization using PowerBI, the dataset set used contains 14 attributes from 1025 patients. The project highlights the different factors attributing to heart disease and their relationship. The dataset used in this project are available on https://www.kaggle.com/datasets/johnsmith88/heart-disease-dataset/code
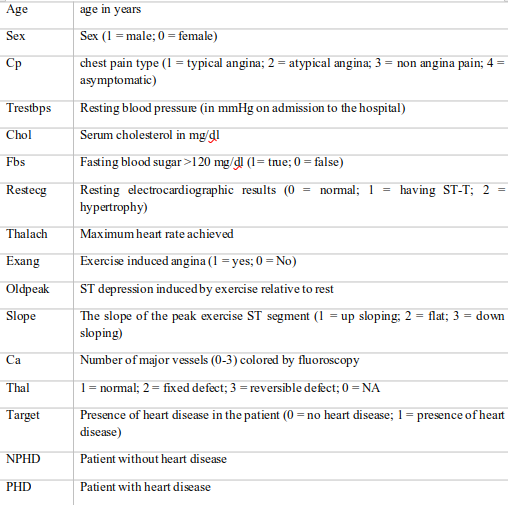
Definition of Terms
Import the data provided in the link above into PowerBI and transform data. There are few adjustments we will be making to this data as listed below
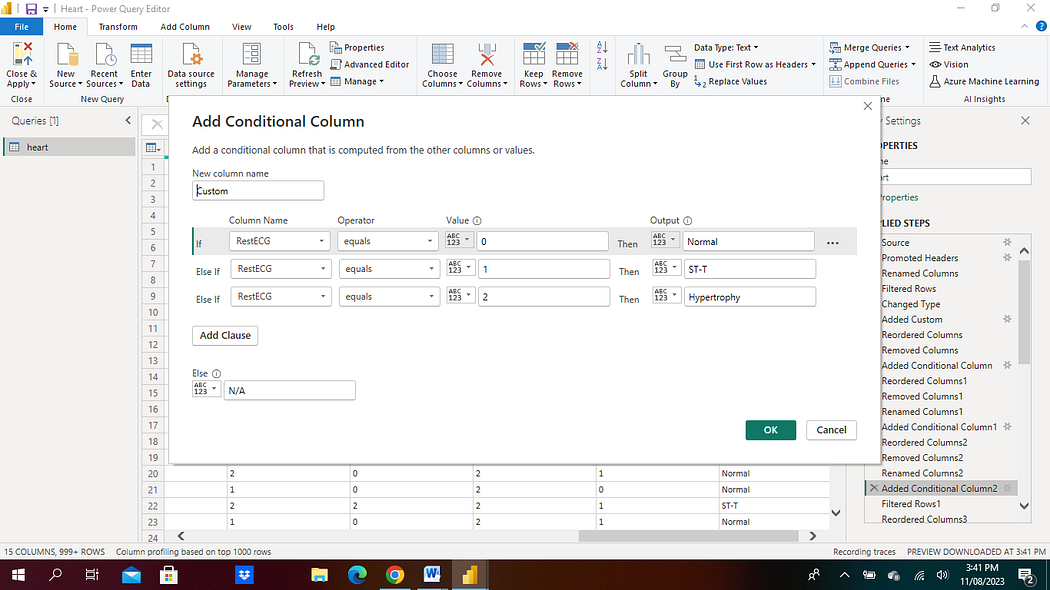
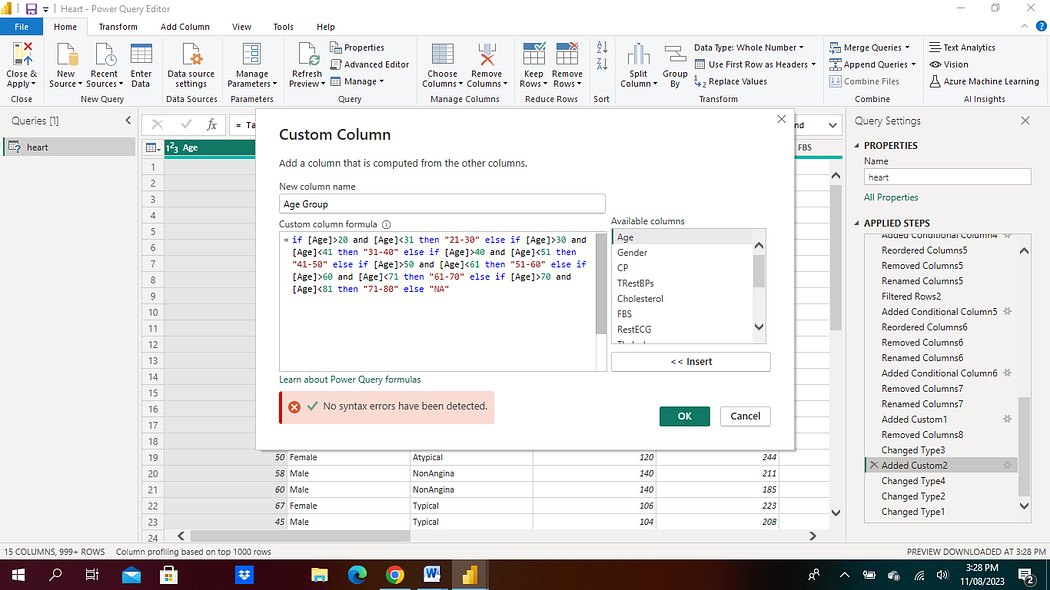
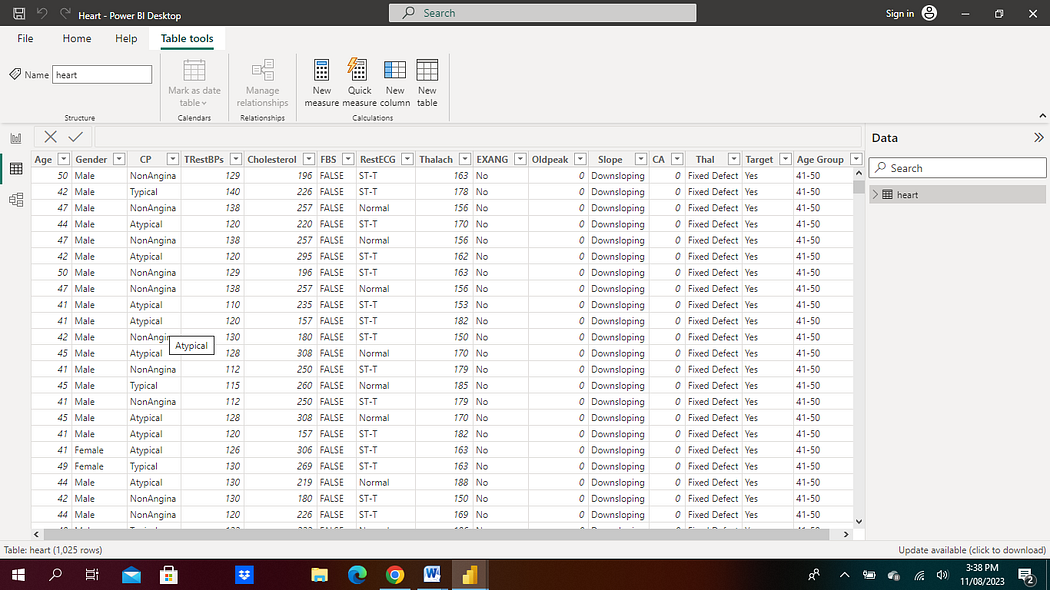
Some numerical values are replaced with their definitions using the conditional column formatting [A1], after which the original column. A new column was created DAX expression described in [A2]. The data [A3] is then loaded for proper analysis.
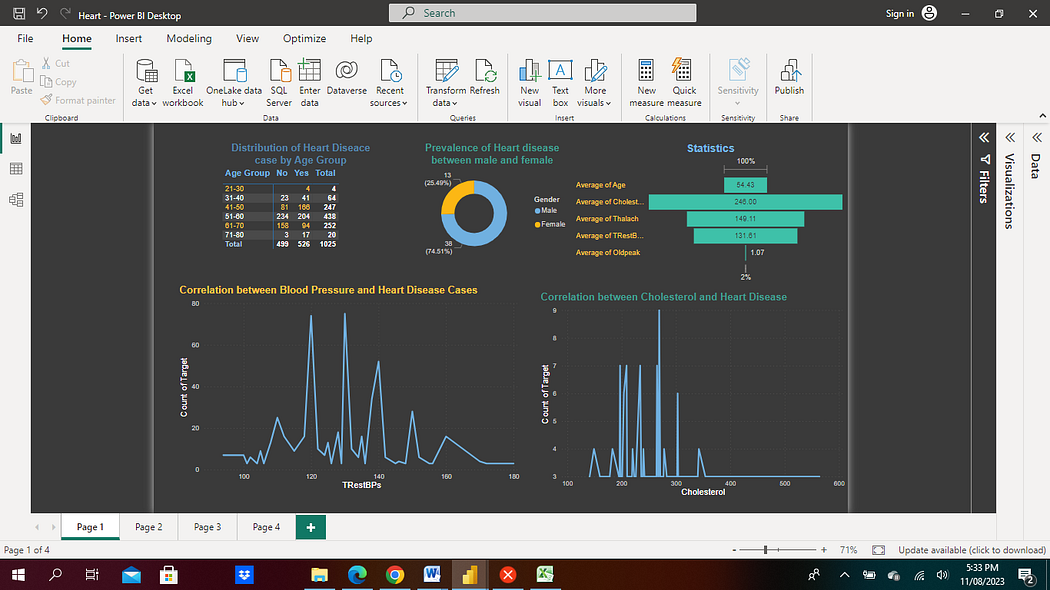
Gender distribution of the registered patients
A total of 1025 unique patients’ info was used for this analysis. 312 constituting 30.44% of the total was female, while 713 patients are male. This distribution infers that a larger percentage of patients susceptible to heart disease are male.
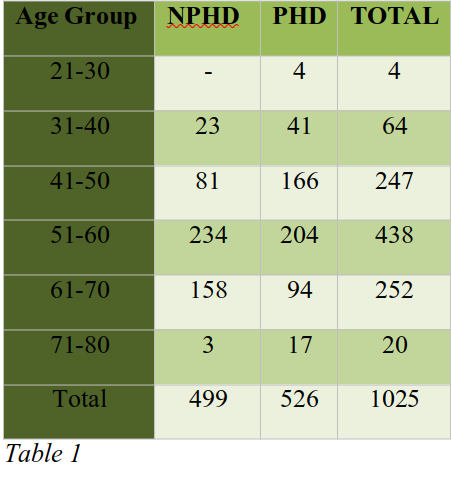
Out of 1025 patients only 526 patients have heart disease with 57.03% are male while 42.97 are female. From table 1 below, the patients within the age groups 41–50 years and 51–60 years are more susceptible to heart diseases.
Gender Distribution of PHDs by TrestBPs
The PHDs are sparingly distributed across the different resting BPs but 14.26% of the PHDs have resting BP of 130 which is the BP with the highest occurrence.
Successively, 14.07% of the PHDs have a BP of 120; this is the highest occurring BP for female.
All male with BP of 160 are within the age group 61–70years while female with BP 110 and 130 all have fixed defect.
In male, with BP 110 and within the age 41–60 years have the resting electrocardiographic results as ST-T. 33 out of 44 males with BP 120 have Atypical angina chest pain 21 out of 30 females with the same BP have non angina pain with resting electrocardiographic results as ST-T
Gender Distribution of PHDs by Chest Pain
About 72.44% of the female with Chest Pain are PHDs. A higher percentage of which are female patients suffering from non angina pain.
Below half of male with chest pain are in the PHDs class. The table 2 below highlights the distribution of chest pain; the figures in red represent the number of PHDs.
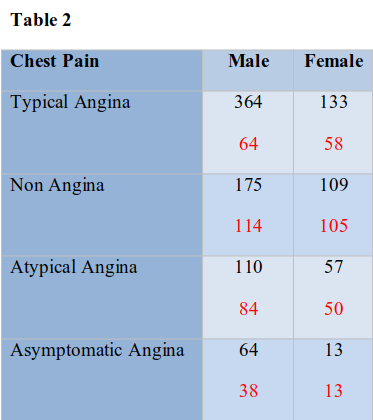
From table 2, it is observed that all the women with asymptomatic angina are PHDs and 76.4% of the males with Atypical angina are PHDs while Typical Angina poses the least threat for both male and female.
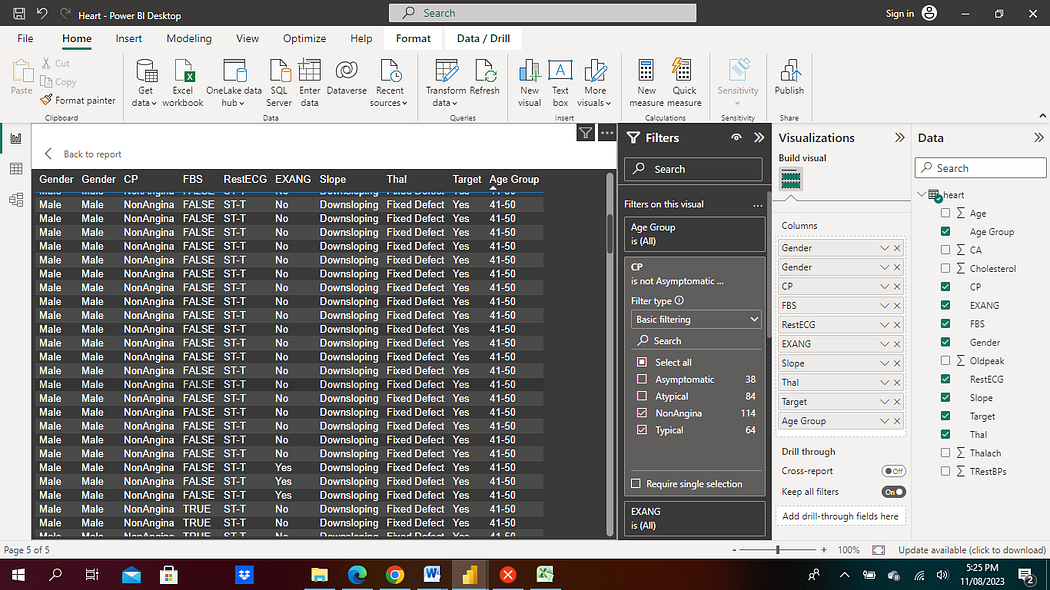
Figure 1: Male with non angina chest pain
In comparison with slope, none of the patients with an upslope is a PHD, no female with asymptomatic chest pain have a flat slope. Most males with typical, non angina and atypical chest pains are downsloping.
Gender Distribution of PHDs by Cholesterol levels
269 had the highest PHDs at 9 which accounted for 3.98% of the female PHDs majority of which had resting electrocardiographic results as ST-T, followed by 197 and 209, which tied for second at 7. There 64 distinct cholesterol levels for female, the number of PHDs for each ranges from 3 to 9.
Similarly, there are 67 distinct cholesterol levels for male, the most recurring cholesterol level for male was 175 which had the highest PHDs at 11, 8 of which are within the age group 31–40 years and accounted for 3.67% of the male PHDs. The number of male PHDs for each level ranges from 3 to 11.
Statistics
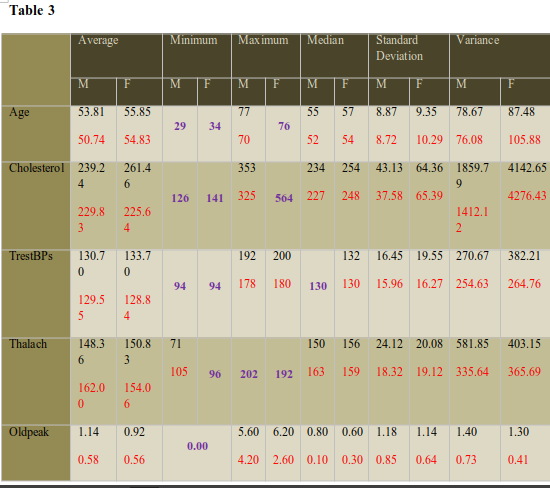
# Values in red are associated to the PHDs while values in purple are the when the general patient values equals the PHDs value
The dataset set used contains 14 attributes from 1025 patients. A new attribute was added to group the patients by their age. Relationships between the resting BP, Age, Chest pain, resting ECG and cholesterol were established. The appendix is shows some of the methodology used in this analysis.
A1
Conditional column formatting
A2
DAX expression for adding column — Age Group
A3
Data view after Transforming
A4
Dashboard view
Adeyemi Oluwafunmike Yemisi
Contact: olufunmikeyemi@gmail.com